


You can draw pie charts using the same structure as bar plots.
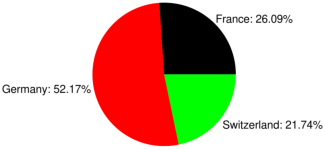
The camembert command draws pie charts.
| camembert([["France",6],["Germany",12],["Switzerland",5]]) |
| camembert([[4,"*First*","*Second*","*Third*","*Fourth*"], ["A",2,5,4,7],["B",5,6,7,8],["C",6,6,5,3]],color=[teal,olive,gold]) |
