20.1.8 Box-and-whisker diagrams
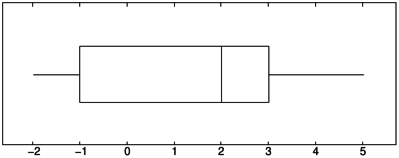
A box-and-whisker diagram is a graphical view of the quartiles of a list of
numbers. The diagram consists of a line segment from the the
minimum of the list to the first quartile, leading to a rectangle from
the first quartile to the third quartile, followed by a line segment
from the third quartile to the maximum of the list. The rectangle
contains a vertical segment indicating the median.
The boxwhisker
or mustache
or boxplot
command creates boxwhisker(s) for given list(s).
-
boxwhisker takes one mandatory argument and four optional arguments:
-
L, a list or matrix of real numbers.
- Optionally, x=xmin..xmax or
y=ymin..ymax, which spreads several
boxwhiskers horizontally (with x) or vertically (with y, which
is the default).
- Optionally, color=c, where c is a color or a list of colors specifying
the fill color for each boxwhisker (if c is a single color, then all boxwhiskers
are colored with that color).
The list may be empty, in which case light grey color is used. By default,
no fill color is specified and boxwhiskers are drawn only with lines.
- Optionally, legend=d, where d is a list of strings which
are drawn next to boxwhiskers, in the given order.
- Optionally, axes, the symbol specifying that the usual axes
should be drawn.
- boxwhisker(L ⟨,options ⟩)
draws a boxwhisker for the list L or one for each column of the matrix L,
aligning them vertically (topmost is the first) or horizontally (leftmost is
the first).
Examples
| boxwhisker([-1,1,2,2.2,3,4,-2,5]) |
To generate some normally distributed data, enter:
| L:=tran([seq(randvector(10,randvar(normal,mean=ln(j),stddev=2)),j=1..10)]):; |
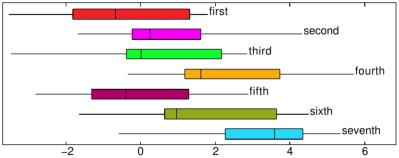
Vertical alignment (the default, suitable for a small number of boxwhiskers):
| c:=colormap("discrete","vivid"):;
names:=["first","second","third","fourth","fifth","sixth","seventh"]:;
boxplot(tran(col(L,0..6)),color=c,legend=names) |
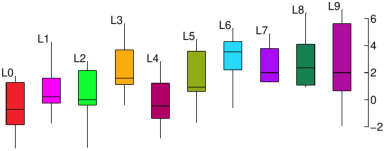
Horizontal alignment:
| boxplot(L,x=-5..5,color=c,legend=zip(concat,["L"$10],apply(cat,range(0,10)))) |