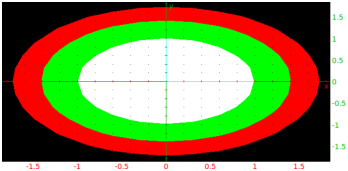
The plotcontour or DrwCtour or contourplot command draws contour lines for functions of two variables.
| plotcontour(x^2+y^2,[x=-3..3,y=-3..3],[1,2,3],display=[green,red,black]+[filled$3]) |
| plotcontour(x^2-y^2,[x,y]) |

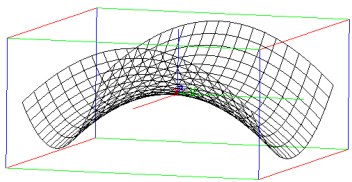
If you want to draw the surface in 3D representation, use plotfunc (see Section 19.2.2).
| plotfunc(x^2-y^2,[x,y]) |